Our stats struck a nerve, now let’s hit back against inequality
Oxfam made headlines this week with our stats on wealth inequality, particularly the finding that the 62 richest people in the world own as much as the poorest half of the world’s population. We’re pleased that people want to know more and dig into the detail of how we came to these findings. Last year we were questioned on our calculations and we provided robust explanations – the story has been nicely reviewed by the New Yorker in the article ‘Critics of Oxfam’s poverty statistics are missing the point’. This year new questions have been raised, which provides another opportunity for us to explain why these results are so important.
Both the richest sixty-two individuals and the poorest half of the world’s population have a collective net wealth of $1.7trillion. To get to this figure for the 62, we added up the wealth of the richest individuals on the planet, as published by Forbes. Unlike household surveys which under represent the very richest people (billionaires are often busy when the survey company calls), Forbes deliberately examine the wealth of the richest. This wealth can fluctuate dramatically day to day as the prices of their assets change in the market. Forbes’ daily tracker provides a fascinating insight into the wealth of the richest and how it changes.
When shared between 3.6 billion people, $1.7tr works out at about $500 per person. The source of this data is the annual Global Wealth Databook published by Credit Suisse. It is a mine of information on global wealth, breaking down these stocks by financial and non- financial assets and debt. They draw on Household Balance Sheet data and other data sources, including the Forbes data on billionaires to produce the most accurate estimate available on what global wealth looks like. Those in the bottom 50% include people in debt, people with nothing and people with a net wealth of up to about $5,000. People with little, no or negative wealth, especially in developing countries with poor social insurance mechanisms (four out of five people in the bottom 50% live in Africa or Asia – including China and India), will not only find it hard to respond to financial shocks – like a poor harvest or a medical bill, but will also find it much harder to invest in their families’ future.
Some of the people in the poorest 50% may have zero or negative wealth and live in rich countries (Harvard graduates for example), and this has called some critics to question how meaningful the data is as a result. But, whilst this is anecdotally interesting to think about, this does not affect the overall picture of wealth distribution. So, as Tony Shorrocks the author of the Credit Suisse report said last year the inclusion of indebted people from developed countries is “a non-issue” and “a diversion”. That 62 individuals have the same amount of wealth as 3.6 billion people is shocking. It has quite rightly grabbed the attention of people all over the world. But is this any better or worse than it has been in the past? Credit Suisse and Forbes have both been generating this data for some time now, which allows us to track the concentration of wealth over time. We find that the billionaires’ wealth is booming, the top 62 now own half a trillion dollars more than they did just five years ago. Over this same period, the wealth of the bottom 50%, in fact the wealth held by the bottom 90%, has fallen.
Each year both Forbes and Credit Suisse convert wealth held in local currencies to US$ based on the prevailing exchange rate. Credit Suisse explain in their methodology that this is the most appropriate conversion to use, given that most wealth is held by wealthy individuals who have access to and actively use international financial markets. Over time the value of currencies will fluctuate. At the start of 2014 one Russian Ruble was worth 30 cents, today a Ruble is worth less than half that. Obviously wealth held in Russian Rubles is worth a lot less in USD terms now than it was two years ago. However not all currencies move in the same direction, between 2010 and 2013 the Chinese Yuan strengthened against the dollar for example. Exchange rate changes cannot explain the fall in the wealth of the poorest 50% – the effect of currency fluctuations between 2010-15 is broadly neutral. In truth, do not have a quick and easy answer as to why the wealth of the majority has been falling. There is plenty more research to do in this regard. But one thing is clear, whatever is driving down wealth at the bottom is not having the same effect on the wealth at the top.
Some critics have suggested that a fall in the wealth of the poorest doesn’t matter when extreme poverty (measured according to incomes) is falling. Two things are important to mention here, firstly that wealth is important – not only because it determines a person’s ability to respond to financial shocks, but also because at the other end of the distribution, with wealth comes disproportionate power and influence over policies and structures that affect all of us. And secondly, whilst poverty reduction has been impressive, our analysis of income inequality shows that it’s not been good enough. In the 25 years from 1988 to 2011 the incomes of the poorest 10% of people has increased from 54 cents a day to 72 cents a day, or less that 1% of global income growth. Unless income inequality is reduced, we will fail to eradicate poverty by 2030. In response to similar challenges from last year, Branko Milanovic sums up the distinction between income and wealth inequality and why it is important we look at both.
As the world’s business and political leaders gather in Davos this week, we are reminding the world that inequality is at crisis levels. It makes no economic or moral sense for so much wealth to be concentrated in the hands of so few. And whilst questions on data and methodology are important let them not detract from the fact that the extreme levels of wealth inequality we point to are real, and must be taken seriously.
Related Items:
- Oxfam’s new report: “The Economy for the 1%“
- Watch a video explaining the stats
- Support our call for action for a more equal world
Discover more stories
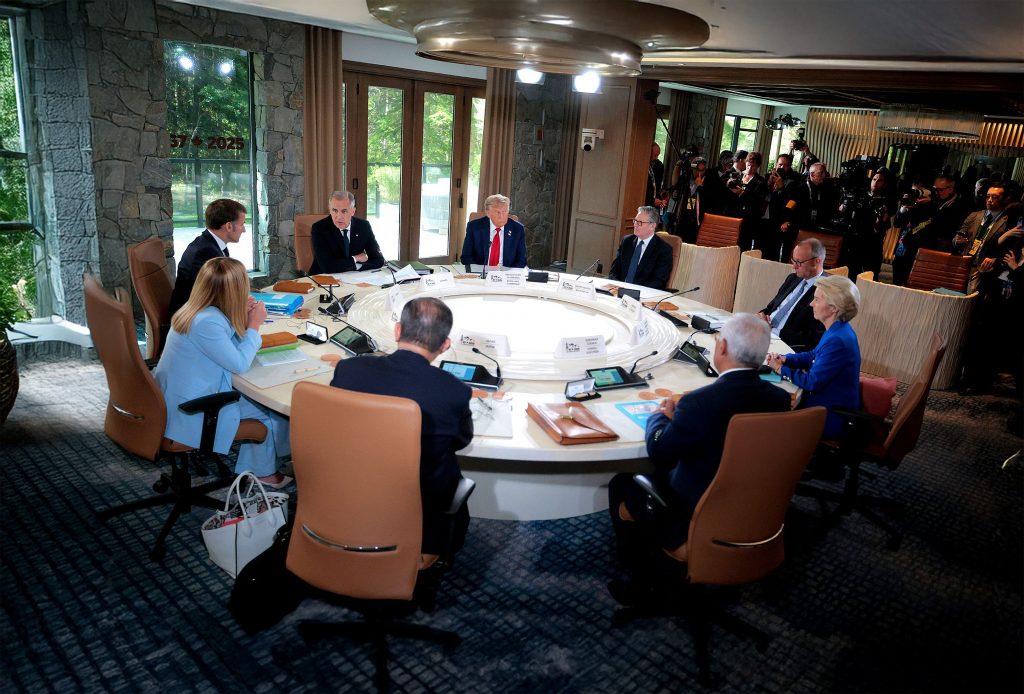
From June 15-17, leaders from the world’s most powerful economies gathered in Kananaskis, Alberta for the 2025 G7 Summit, a high-level annual meeting where Canada, the United States, the United…
Oxfam reveals fossil fuel giants made $583B in 2024 profits amid rising climate harms. Strong public support in Canada backs a new 'polluter profit tax' to fund climate recovery and shift to renewables. Global action needed to hold polluters accountable and tackle inequality.